
Recently, I wrote about specialty charts, such as the high-res bathymetric products from CMOR Mapping. I had no idea that mere months later that specialty content would become mainstream. Garmin, Navionics and C-Map have all debuted what they call, respectively, Relief Shading, SonarChart Shading and Reveal.
These charts show remarkable details in reefs, wrecks and other bottom structure offshore, and in a few nearshore zones. And while the regions covered remain select—mainly limited to areas of fairly dramatic relief—they can truly change a captain’s perspective, and open up previously unknown fish-holding features.
Federal Surveys
“Primarily the data [for all high-res bathymetry content] is taken from official NOAA multibeam sonar surveys,” says Paul Wilson, customer relations and product specialist for C-Map, which is owned by Navico, makers of Simrad and Lowrance electronics. “It’s published and free. We combine it with our own data we’ve collected and with other official surveys.”
C-Map Reveal uses shades of red, green and blue to create the look of 3D relief. Resolution varies from area to area: In some locations, it’s 1-meter resolution. “Off Miami, you can see the clusters of coral,” Wilson says. Other areas might be less clear, where there’s 10-meter resolution. Reveal is compatible with recent Lowrance and Simrad plotters.
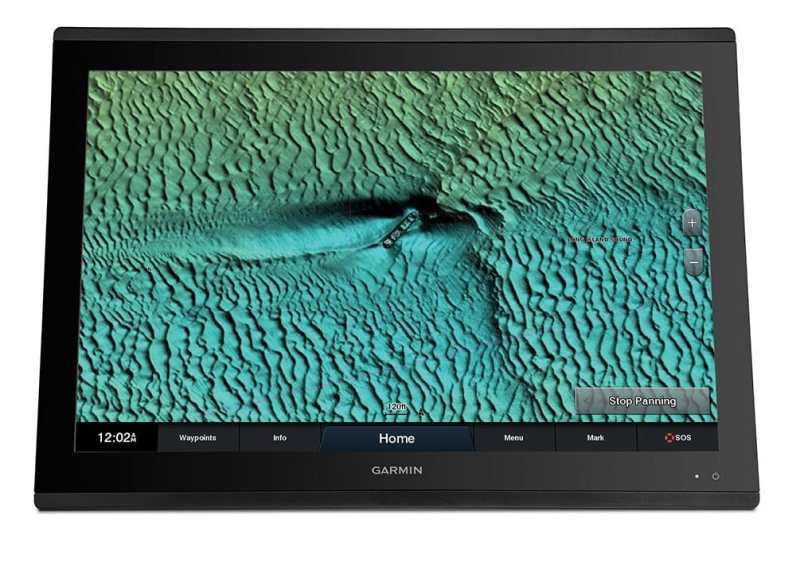
Garmin uses the same NOAA multibeam surveys as well as its own collected data plus content from electronic chart-maker Navionics, which Garmin purchased in 2017. Until this month, Garmin’s Relief Shading, available on g3 Vision chart cards (compatible with most Garmin plotters), focused only on areas where the data could provide 1-meter resolution. As of this month, Garmin will offer Relief Shading throughout select areas of the U.S. coast, using source data that’s clear and discernible down to 1-centimeter resolution.
“What separates Garmin from its competitors is our ability to blend High Resolution Relief Shading with Fishing Layer contours generated from Navionics detail,” says David Dunn, Garmin director of sales and marketing. “This gives fishermen an advantage unmatched by competition and available at a reasonable price point ($349 to $499 per full-featured chart card). The expansion in coverage will be available through New Chart Guarantee to eligible existing customers, pre-loaded on new cards, and available through the Active Captain app and the Garmin Update program.”
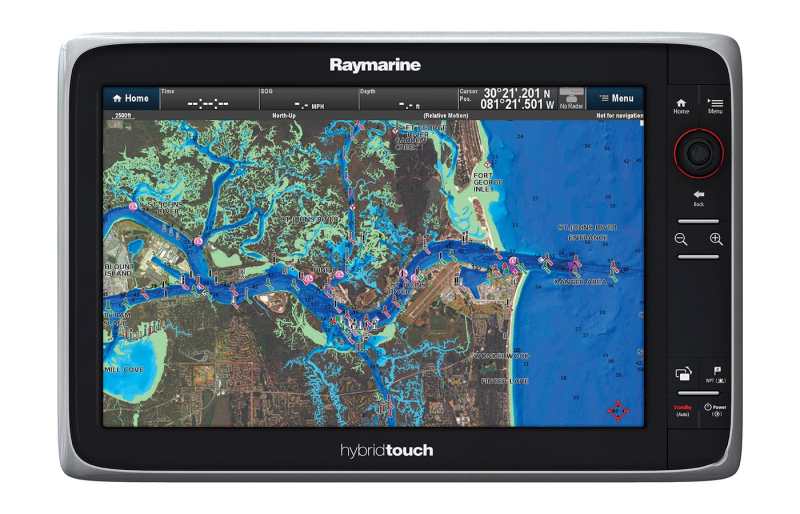
Navionics combines the NOAA surveys with its own data as well as crowdsourced community data to provide SonarChart Shading for Platinum+ Marine chart cards. Navionics is compatible with Raymarine, Simrad, Lowrance and Humminbird units.
Big Reveal
C-Map Reveal charts cost $299 and contain full MAX-N+ vector navigation data, including satellite imagery, an Insight Genesis community layer, as well as detailed marina and port plans. East Coast regions include:
- New Orleans, Louisiana, to Brownsville, Texas;
- St. Lucie Inlet (Stuart, Florida) to New Orleans;
- Florida and the Bahamas;
- Gulf of Maine, Cape Cod, Massachusetts, and Long Island, New York;
- Long Island to Norfolk, Virginia (out to the canyons);
- Norfolk to Jacksonville, Florida.
West Coast regions include:
- Cape Flattery, Washington, to Cape Blanco, Oregon;
- Cape Blanco to Point Sur, California;
- Santa Cruz, California, to San Diego.
Within all of these zones, coverage can be intermittent. “In the Florida Keys, the coverage is inshore, along the islands, and there are some spots like the Islamorada Hump,” Wilson says. “In the Vineyard area, the sound has some spots; Block Island and the Race are pretty good. It’s primarily where the biggest relief is.”
Extra Relief
Garmin’s g3 Vision charts range in price from $349.99 to $499.99 and include integrated Garmin and Navionics vector (and downloadable NOAA raster) charts plus Relief Shading, Auto Guidance, satellite imagery, aerial photography, 3D views, and more. Regions in the United States with the new, more-detailed shading include:
- Pacific Coast (Vancouver, British Columbia, to San Diego);
- four zones along the Gulf coastal states;
- four zones along the East Coast;
- smaller subzones in the Southeast and Northeast;
- seven Alaska zones.
Other g3 Vision charts with the initial Relief Shading release cover regions of the Bahamas, Bermuda and Canada.
Navionics Platinum+ users who have an active subscription to daily updates can download SonarChart Shading through the chart installer. Shading is available on all new Platinum+ Marine cards, which cost $199 (small-area coverage) or $399 (large-area coverage). A one-year daily-update subscription is included with the purchase of a new card; subscriptions can be renewed at a discounted rate from the purchase price.
SonarChart Shading coverage regions for small-area charts include:
- Gulf of Mexico;
- Chesapeake Bay;
- Florida and northern Bahamas;
- South Carolina to northern Florida;
- California and Oregon;
- Southern California, Baja and Hawaii;
- North Carolina;
- Maine;
- Boston to New York.
For large-area charts, regions include:
- Southeast Florida/northern Bahamas;
- U.S. Northeast and canyons;
- U.S. mid-Atlantic and canyons;
- Gulf of Mexico;
- Caribbean and Bermuda;
- West Coast/Hawaii;
- Mexico/Central America;
- South Alaska;
- Northwest Alaska.
Update Options
Since all companies source NOAA for its multibeam sonar data, I asked NOAA officials what other areas they intend to survey and how often they will update their charts. “Some places are surveyed more frequently than others, but many just the once with modern tech, and there are no immediate plans for a refresh,” says Jerry Slaff, NOAA public affairs specialist.
Read Next: Alternative Charts Can Add Navigation and Contour Data
Plans include new surveys of additional reef tracts and coastal waters throughout the country. But federal budgetary issues can make planning difficult. “Every year is tentative until we get appropriations and any other influencing factors, like hurricanes or other emerging priorities that cause plans to change. So these plans are not written in stone,” he says.


