Not only do rapid-fire digital innovations give us ever-cooler electronics hardware, but they also create new software programs we never even knew we needed. Witness the rise of alternative charts — such as those by CMOR, Standard and Isla — right now geared toward specialty needs such as inshore marsh navigation and finding offshore structure.
“With the technological advances in the past five years, you don’t need a supercomputer to process all this chart data,” Raymarine marketing manager Jim McGowan says. “So it’s possible for a small startup to gain access to NOAA data, see what else is available, and then figure out a niche for the needs in the market.”
When Raymarine launched its LightHouse charts in 2012, the company put together a development kit so any entity offering electronic mapping could design its products to work with Raymarine systems. Other major marine-electronics manufacturers planned similarly, and even added new features to their own products, creating better contours and providing community as well as professional-guide input.
Standard Mapping
Standard Mapping, for instance — a company based out of Louisiana that first made custom paper charts more than 30 years ago — works with Raymarine, Simrad, Lowrance and Garmin units. “We’re very connected to local marinas and professional guides,” founder Glenn Schurr says. “We’re getting the knowledge that the fisherman needs so we can put that into a card.”
Schurr started his charting career in the early 1980s while working for a defense contractor. An avid fisherman, he wanted more information about his favorite hot spots. That led him to locate multiple sources for aerial imagery, which he turned into printed maps.
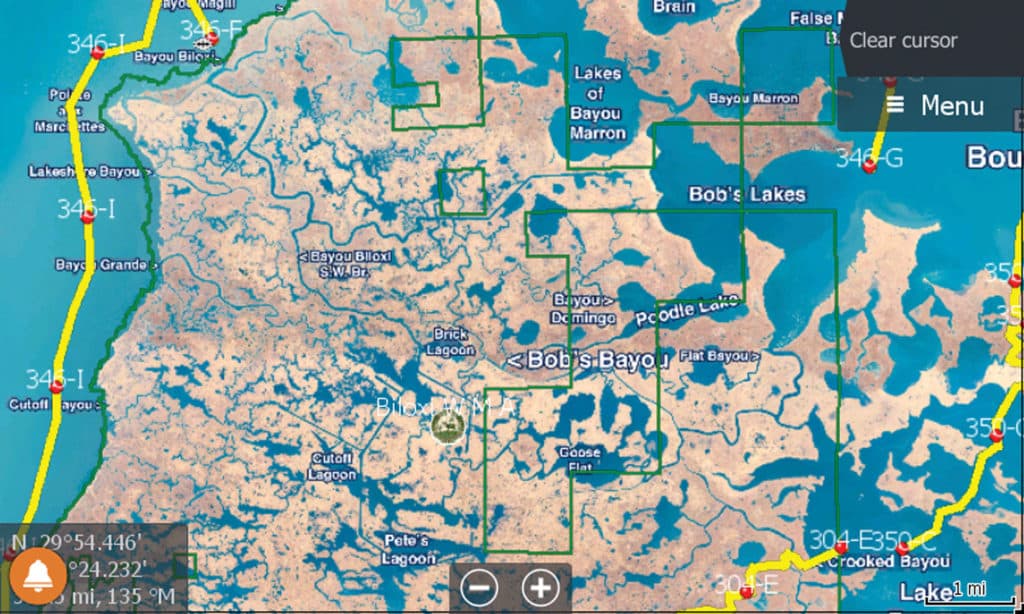
Now his company provides electronic charts with high-resolution aerial imagery for all Gulf Coast states as well as all of Florida. Most of the time, Standard employs low-tide imagery; the company also enhances underwater structure so it appears on the charts. “You can find something as small as a rocking chair in the marsh in Louisiana,” he says.
Standard also provides enforcement lines for regulatory boundaries as well as safe routes for bisecting shallow regions. “We pay a guide to run those routes,” Schurr says. “A lot of expense and time goes into that.”
The aerial images simply overlay onto Standard’s government- and private-sourced navigational charts, so anglers need only the single chip. When fishing offshore, anglers don’t need aerial imagery, so Standard provides navaid and structure information along with bathymetry.
The company generally updates aerial images twice a year. Anglers who purchase a card — ranging in price from $149 to $499, depending on the region and level of detail — qualify for free updates for a year and pay $50 for each subsequent refresh.
CMOR Mapping
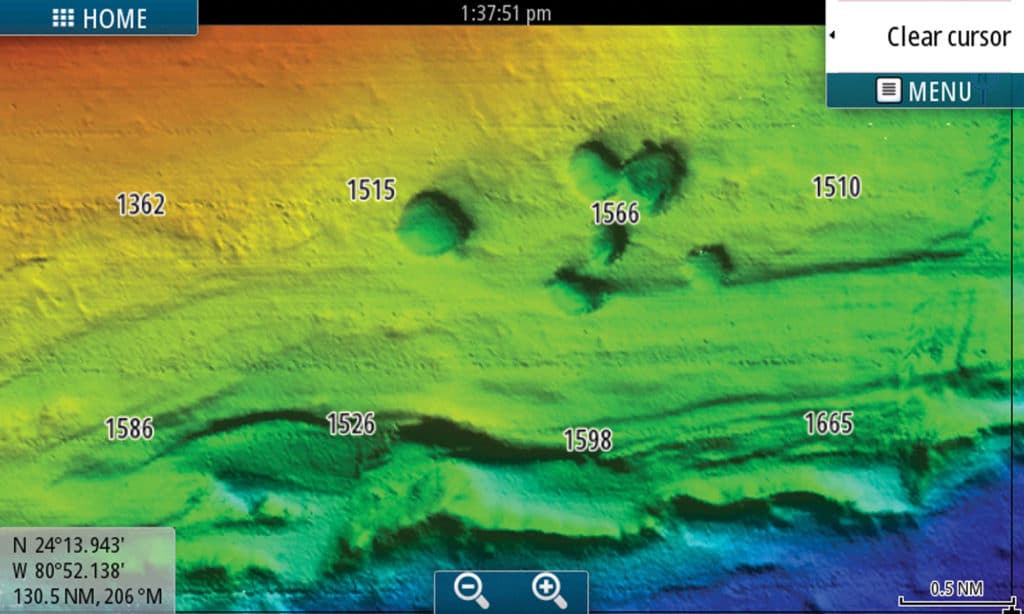
CMOR sought to fill a niche for saltwater anglers and scuba divers seeking highly detailed ocean-bottom and structure views. “We bridged the gap between commercially available multibeam data done by government and agencies, and developed processes to take large amounts of data, preserve the resolution, and make it available,” says Erik Anderson, CMOR co-founder.
Anderson, an ocean engineer with a master’s degree in marine science for mapping the seafloor, first began pulling together data for the South Florida region. CMOR released its first retail charts in 2017. Now the company also offers coverage at the Gulf’s Middle Grounds as well as throughout the western Gulf and much of the southeast and northeast coasts. Anderson expects to add California charts this year.
A quick look at coverage areas on the company’s website does show some gaps between locations. Anderson explains that rather than interpolate data — making assumptions based on surrounding results — CMOR offers true results from actual, collected data.
Read Next: CMOR Mapping Charts
CMOR uses NOAA raster charts in the background on all of its chips. Anglers can overlay any vector data, including their own waypoints (as well as buoys and tides), to see what they’ve been fishing over and what might be next to where they’ve fished. Some anglers split their display screen and run a CMOR chip on one side and a Navionics or C-MAP chip on the other.
“You can go to a new area — say the Marquesas, or someplace you’ve never been before. Traditionally you’d call around to get some spots or find a published reef or wreck. Now you can put in CMOR, and instantly pan over and find ledges and reefs. You can find deep-drop spots within seconds of loading the card. It takes things to a whole new level,” Anderson says.
The highest resolution the company offers is 50 centimeters (about 20 inches). “Anything that size, we’ll see it,” Anderson says. Resolution changes based on depth, with shallower-water spots rendered in the best detail.
Compatible with Lowrance, Simrad, Raymarine, Mercury Vessel View and just recently Furuno, Anderson confirmed, CMOR chips cost $700. Periodic updates start at $100.
Editor’s note: Garmin/Navionics and Simrad/C-Map have just added shaded-relief detail to their charts based on data similar to what CMOR uses.

Isla Mapping
Florida’s miles of marsh and wetlands constantly change; ever-varying tides alter water depths throughout the day. NOAA data can’t always accommodate the many variables found inshore. That’s why Glenn Housman made it his mission to provide inshore anglers with better chart detail.
Housman launched his first Florida Marine Tracks charts in 2013. Today, he offers north and south Florida charts, Louisiana coastal charts, and offshore multibeam sonar charts for Gulf and East Coast waters. “Markers in the Everglades were always missing from the charts I’d use. All the local posts and buoys — missing,” Housman says. “What people would do and still do is over time, they figure things out and add waypoints to their [NOAA-based] charts. And they’d keep their saved tracks so they could see where they’ve run before.”
When Housman entered the chart market, he says he wanted to improve the aerial imagery: “I wanted pictures so good, you could zoom in to 50 feet, and it would be clear. I wanted them everywhere in the state, and I wanted them bright and adjusted so you could see sandbars underwater,” he says.
He also sought to improve chart accuracy, adding arbitrary objects such as stakes and concrete poles and abutments. “We did it by hand,” he says, explaining that he and others physically visited the locations and documented them.
Finally, he wanted to add tracks. “I wanted tens of thousands of miles of tracks so no matter where you were and where you wanted to go, there’d be a track,” he says. “I endeavored to measure all of the shortcuts. I did it myself. I did this over the years. I had a personal passion for it.”
Isla charts currently work with Simrad and Lowrance displays, and cost $449 to $649.